


Best and Worst Super Bowl Square Numbers

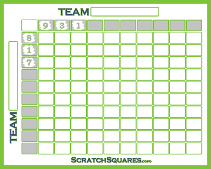
To use this chart, simply find the largest of your 2 numbers in the left column, then the smallest of your 2 numbers in the top row. Where these numbers intersect will show the number of times this combination has happened at the end of any quarter of every Super Bowl.
Individual Numbers
The chart above lists number combinations, we have taken this a step further by breaking it down to how many times each individual number has occurred. There are 480 possible single team scores. Based on the past 60 Super Bowls the numbers most likely to hit are as follows:The number 0 appeared 131 times - 27.29%
The number 7 appeared 87 times - 18.13%
The number 3 appeared 77 times - 16.04%
The number 4 appeared 50 times - 10.42%
The number 6 appeared 37 times - 7.71%
The number 1 appeared 30 times - 6.25%
The number 9 appeared 24 times - 5.00%
The number 8 appeared 17 times - 3.54%
The number 2 appeared 15 times - 3.13%
The number 5 appeared 12 times - 2.50%
Past Super Bowl Scores
At the bottom of this page we have links to pages that list the score by quarter for all of the past Super Bowls, from Super Bowl 1 to Super Bowl 60. We have also listed the last digit of the scores at the end of each quarter, which is typically used to decide the winning squares.
Best Numbers in Each Quarter
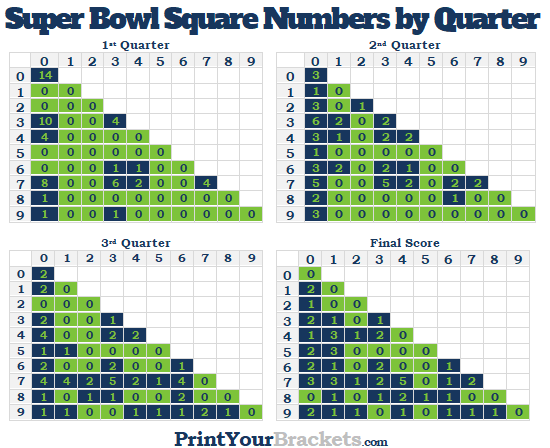
The most popular number combinations at the end of each quarter:
1st Quarter - 0,0
2nd Quarter - 0,3
3rd Quarter - 3,7
4th Quarter - 4,7
Score by Quarter for Each Super Bowl
1 - 10 | 11 - 20 | 21 - 30 | 31 - 40 | 41 - 50 | 51 - Present
View the Past Super Bowl Winners and Scores.