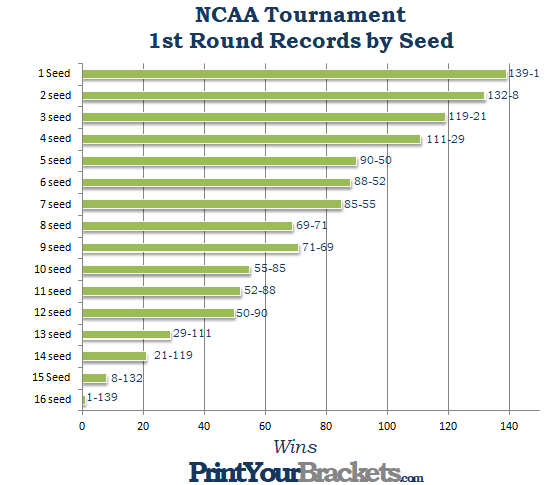
NCAA Tournament First Round Record by Seed
We have collected data from 35 NCAA Tournaments. The information below is from 1985 through 2019. The first year there were 64 teams in the tournament was 1985. The data shows the record of each seed in the first round of every tournament.
A few Fun Facts:
* In 2018 #1 Seed Virginia lost to #16 UMBC, this was the first and only time a #1 seed lost to a #16 Seed.
* All four #1 seeds have only advanced to the final four 1 time
* The lowest seed to win a championship was a #8 Seed
* A #5 seed has never won the championship
Records by Seed Matchup
The table below shows the records for each pairing in the first round of the NCAA Tournament. We analyzed data from 35 tournaments, and there are 4 matchups per tournament, per seeded pair(1 for each region), for a total of 140 games for each seed.
#1 Seed vs #16 Seed - 139-1 - 99.29% Winning Percentage #1 Seed
#2 Seed vs #15 Seed - 132-8 - 94.29% Winning Percentage #2 Seed
#3 Seed vs #14 Seed - 119-21 - 85.00% Winning Percentage #3 Seed
#4 Seed vs #13 Seed - 111-28 - 79.29% Winning Percentage #4 Seed
#5 Seed vs #12 Seed - 90-47 - 64.29% Winning Percentage #5 Seed
#6 Seed vs #11 Seed - 88-51 - 62.86% Winning Percentage #6 Seed
#7 Seed vs #10 Seed - 85-52 - 60.71% Winning Percentage #7 Seed
#8 Seed vs #9 Seed - 69-71 - 49.28% Winning Percentage #8 Seed
Here is the data made into a graph!

What does the data show?
The data shows basically exactly what one would think, the closer the seed pairings, the more likely an upset is to occur. One thing I notice from the chart is the percentage jump from the 4 seed/13 seed to the 5 seed/12 seed game is noticably larger than any other pairing. Another thing to note is the #8 and #9 pairing, where the 9 seed has actually won more games.
If you liked this article check out Final Four Appearances by Seed and NCAA Tournament Championships by Seed, where we go into detail about which seeds are most likely to advance to the Final Four and also win the tournament.


