Best and Worst March Madness Square Numbers
Number Combinations
We have analyzed the final scores from every NCAA Tournament game beginning in 2001. We collected this data for 18 years/tournaments, to show which numbers and number combinations are most likely to happen in your NCAA Square Pool.
We used the final score from all 63 games of each of the 18 tournaments for a total of 1,134 number combinations. This data does not include the play-in games.
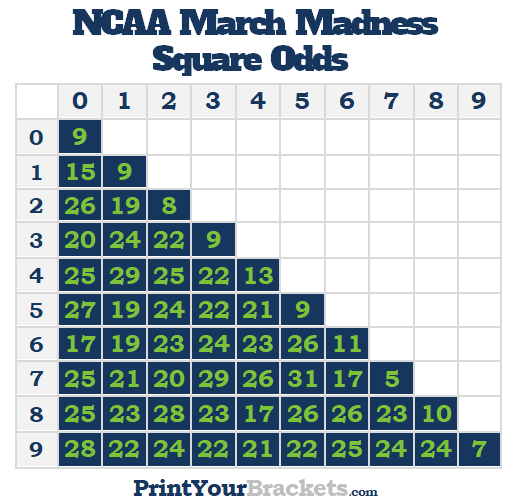
The chart below shows the number of times each possible number combination has appeared. There are a total of 1,134 final scores used to make up this chart. The most popular number combination 7-5, appearing 31 times.
To use this chart, simply find the largest of your 2 numbers in the left column, then the smallest of your 2 numbers in the top row. Where these numbers intersect will show the number of times this combination has appeared.

Individual Numbers
We have also broken this down to which individual numbers have appeared the most times. From the table below, using the past 18 March Madness tournaments, there are 2,268 possible team scores. As we expected there is not a whole lot of fluctuating for the individual numbers. However, the most common number is a 5 and the least common number was a 1.
The number 5 appeared 236 times
The number 4 appeared 235 times
The number 8 appeared 235 times
The number 2 appeared 227 times
The number 0 appeared 226 times
The number 7 appeared 226 times
The number 9 appeared 226 times
The number 3 appeared 226 times
The number 6 appeared 222 times
The number 1 appeared 209 times
Conclusion
The most obvious assumption to take away from the chart above is that you do not want to end up with duplicate numbers(same number in the top row and left column). As you can see from the chart, the 10 different duplicate numbers were the last 10 in most common occurrences. Obviously the reason for this is a game cannot end in a tie, therefore in order to win a square with a duplicate number a team would have to win by at least 10 points.
Other than that, there's not a whole lot of difference from one number combination to the next. Most of the number combinations appeared between 20-25 times. The least common non-duplicate number combination was 8 and 4, only appearing 14 times.
Odds of Winning a Square
Ignoring the chart above and assuming you are in a pool where all 63 games of the tournament are being used, and you are using a 100 square grid. You have 63 out of 100 or a 63% chance of having at least 1 winning square.


